


Understanding Growth & Its Key Drivers
Using Alphabet (GOOG) as our "guinea pig" to estimate intrinsic value growth

Unlock Premium Content – For just $0.39/day ($12/month) or $0.27/day ($100/year)!
📎 Full Portfolio Content - 🗓️ Biweekly Updates (Last Update: 28-Jun-2025)

Expanse Stocks x Finchat (now Fiscal AI) Partnership!
🎁 Get 20% off + 2 months free on any plan! →📎 Claim Discount
Welcome back Explorer!
If you’ve spent any time thinking about what drives long-term shareholder returns, you’ll quickly realize it’s not just about finding growing companies, it’s about understanding what fuels that growth and whether it’s sustainable.
The truth is, while valuation matters, especially in the short term, it’s the underlying business fundamentals that drive returns over longer horizons. Intrinsic value growth reflects a company's true worth based on its fundamentals, like future cash flows and profitability, and it’s the engine of compounding. Knowing what makes that engine run smoothly is one of the most valuable skills any investor can develop.
Let’s unpack the key drivers behind intrinsic value growth and more importantly, how they tie back to shareholder returns.
📰 What’s New at Expanse Stocks?
📊 Quarterly Update - Portfolio Composition (by Industry and Geography) + Valuation Metrics → 🔗 Behind-The-Scenes [Free access]
📚 Articles
🔎 Deep Dive Briefs
⛅ Cloudflare | 👷♂️ Parsons | 𓇲 MPS | 🥼 Medpace | 🔌 Arista | 🛒 Amazon | 🤖 ASML | 🦎 Topicus | 💡 Lumine | ✈ HEICO
💸 General Investing
💎 Hidden Gems Series
✨ Annual Specials – Annual Letters, Investing Philosophy & Top Picks of the Year
📚 Resources for Investors
📢 Latest Stock News
💬 Join My Chat → [📎 Learn more]
👀 Recent Releases!
👀 Coming Soon
💎 Hidden Gem - Fifth Edition
💸 Why Equities Win Against Other Assets
➕ Unlock Premium Content – For just $0.39/day ($12/month) or $0.27/day ($100/year)!
📎 Full Portfolio Content - 🗓️ Biweekly Updates (Last Update: 28-June-2025)
📈 Biweekly Report – Portfolio updates, recent moves & watchlist additions
💼 Full Portfolio Access – Holdings, valuation metrics & performance tracking
📊 Valuation Tools – DCF, reverse DCF, capital efficiency & growth models
🎧 Podcast Picks – Biweekly handpicked episodes on business & investing
🔎 Stock Picking Framework – My methodology & investing philosophy
🎯 Swing Trading – Short-term strategy & latest swing trades
💬 Private Community Chat - 📎 Learn more
🔐 Full access to all my articles
Growth = Reinvestment Rate × Return on Capital
At its core, sustainable intrinsic value growth boils down to an apparent simple formula:
Reinvestment Rate – how much of a company’s profits are plowed back into the business
Return on Capital – how effectively those reinvested dollars generate additional profits
It’s clean, elegant and powerful.
Example:
If a company reinvests 60% of its profits and earns a 25% return on that capital, earnings will grow at 15% per year (0.6 × 0.25). That’s it.
But don’t be fooled by this simplicity, both variables are more complex than they seem and can reveal a lot about a business’s quality, strategy, and future compounding ability.
ROIC and ROIIC: Foundation of Value Creation
Before getting started with this topic, it’s worth mentioning that I wrote a piece on Capital Efficiency featuring ROIC, ROIIC among other related metrics. Feel free to go through it if you’d like to dig deeper first: 📎 Understanding ROIC, ROIIC, and ROCE: Measuring Capital Efficiency
📌 Formula:

🔁 In words:
NOPAT represents the company’s operating profit after taxes, excluding financing costs (the formula to calculate this is on the article shared above).
Invested Capital includes Net working capital, Property, plant, equipment (PPE) and Goodwill & Intangible assets (often related to M&A investments).
Return on Invested Capital (ROIC) tells you whether a business is creating or destroying value. A company earning a 25% ROIC while its cost of capital is 10% is compounding value. One earning 5% ROIC with the same cost of capital is going in reverse.
But here’s where it gets interesting: high ROIC is only valuable if the company can keep deploying capital at those same high returns.
A 25% ROIC is great. But if the business has nowhere to reinvest, growth slows, and the benefits must be returned via dividends or buybacks. On the other hand, a 10% ROIC business that can reinvest 80% of its profits for years may generate better shareholder returns.
🔹 Going Beyond ROIC with ROIIC
Even more important than ROIC — if you want to assess what the future returns of a company may bring — is to measure the returns on newly invested capital, answering the question how effective is the company at deploying additional capital? This is achieved with Return on Incremental Invested Capital (ROIIC).
📌 Formula:

🔁 In words:
You compare incremental NOPAT over one year to the incremental capital invested in the year before that.
This properly matches returns generated in a year to the capital invested in the prior year, since returns take time to manifest.
💡 Why Lag Invested Capital?
Capital deployed in year t-1 generates returns in year t. If you didn't lag it, you'd be incorrectly assuming invested capital immediately produces returns.
📌 Multi-year ROIIC Formula:
To calculate ROIIC over longer periods of time (e.g. 3-year period), you generalize the formula like this:

🔁 Key rules still apply:
NOPAT = growth in operating profits from 3 years ago to now
Invested Capital = growth in capital over the 3-year period preceding those profits
So, you're lagging invested capital by 1 year relative to NOPAT, just like in the 1-year ROIIC formula — just expanded across multiple years.
Alphabet as an Example
Let’s take Alphabet (GOOG) as out guinea pig and calculate its ROIIC over last year, over 3-year period and over 5-year period using Expanse Stocks proprietary models:

One important nuance when calculating ROIIC is that incremental invested capital can be quite volatile from year to year. This is why it’s more insightful to assess ROIIC over longer time horizons—such as 3, 5, or even 10 years—to smooth out short-term noise and get a clearer picture of capital efficiency trends.
At its core, ROIIC is a forward-looking metric. It not only shows how efficiently a company deploys capital, but more importantly, whether it's improving at allocating that capital into high-return opportunities.
We’ll use Alphabet’s ROIIC as a foundation to estimate intrinsic value growth later in this article. But before that, let’s explore the second key growth driver: the reinvestment rate.
Reinvestment Rate: Growth’s Gas Pedal
This is the proportion of profit management reinvests into capex, acquisitions, and working capital. It can be calculated in several ways, but the core idea remains the same: how aggressively is the company compounding its capital?
Breaking Down the Sources of Reinvestment
Understanding where a company reinvests is just as important as how much. Let’s walk through the three primary sources:
1️⃣ Capex (Capital Expenditures)
Capex-heavy businesses, like Amazon (AMZN), require large investments in physical assets. This can be a competitive moat (e.g., Amazon’s logistics network), but also restrictive.
Not all Capex is equal. Copart (CPRT) is a great example—it invests heavily in land, an asset that typically appreciates, rather than depreciates. This smart reinvestment strategy creates a hidden tailwind for long-term returns.
2️⃣ Mergers & Acquisitions (M&A)
Acquisitions are a fast route to growth—if done well. The key is to separate value-accretive M&A from growth-for-growth’s-sake. Look at Constellation Software, which has mastered the art of disciplined, high-return M&A.
3️⃣ Working Capital
Often underestimated or overlooked, shifts in inventory, receivables, and payables can absorb (or release) capital. Smart management of working capital can materially affect free cash flow and reinvestment capacity.
Measuring Reinvestment Rates
There are different ways to calculate reinvestment rates, the most common one is this:
Since we’ll be analyzing reinvestment across multiple time periods, we’ll slightly adjust the standard reinvestment rate formula.
This alternative approach will help us assess how much of a company’s operating profits have been channeled back into growing the business over time.
To calculate the Reinvestment Rate for a specific period:
1️⃣ Calculate the difference in total capital reinvested—this includes CapEx, M&A activity, and Net Working Capital.
2️⃣ Then, divide that total by the cumulative NOPAT (Net Operating Profit After Tax) over the same period.
This gives us a clear picture of how efficiently a company is reinvesting its profits to fuel future growth.
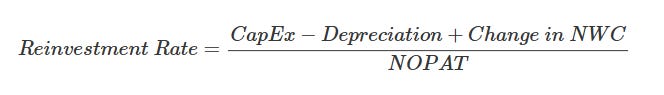
📌 Formula:

Where:
∑ NOPAT = Cumulative (sum of) operating profit after tax over a given period.
Δ Invested Capital = Change in total capital invested over that same period.
💡 Optional: You can also align NOPAT more closely with the ROIIC formula and its ‘lagged’ Invested Capital by using lagged NOPAT (i.e., exclude NOPAT at year t, since that capital wasn’t deployed in time to affect it — but it’s not strictly necessary).
Alphabet as an example
Just as for ROIIC we can calculate reinvestment rates over longer periods of time and generalize the formula above.
Again, let’s take Alphabet (GOOG) as our guinea pig and calculate reinvestment rates over last year, over 3-year period and over 5-year period using Expanse Stocks proprietary models.

Over the past year, Alphabet has reinvested around 31% of its operating profits—an uptick from its 3-year average of 17.4%, though slightly below the 5-year average of 37.6%.
Now that we’ve established how to calculate reinvestment rates—and how much capital Alphabet has been reinvesting relative to its profits—it’s time to put the pieces together. Let’s combine Alphabet’s ROIIC with these reinvestment rates to estimate its expected intrinsic value growth.
Measuring Intrinsic Value Growth
Once you know a company’s reinvestment rate and its ROIIC, you are able to estimate how quickly its intrinsic value is likely to compound over time.
As mentioned in the introduction of this article, it’s a simple yet powerful formula:
Again, let’s test this out using Alphabet:
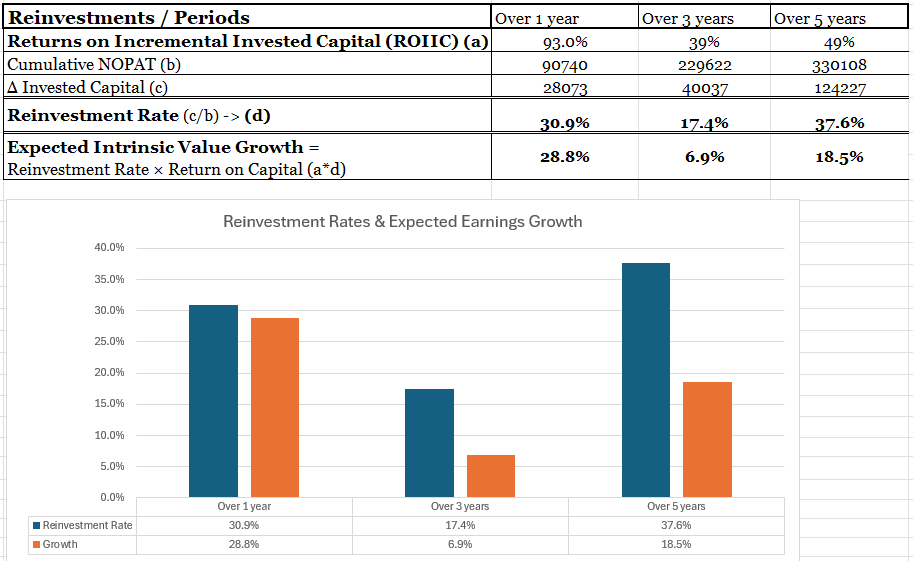
If we look at the reinvestment rate figures, the trend suggests Alphabet is coming out from a stretch of more conservative capital deployment and beginning to lean back into growth mode.
Over the last five years, implied intrinsic growth for GOOG would have compounded at approximately an 18.5% CAGR—slightly below the actual ~20% CAGR, likely boosted by share buybacks (which aren’t captured in the intrinsic growth formula).
Zooming in on the past year, there’s been a noticeable reacceleration, driven by a stronger ROIIC and a reinvestment rate that’s bounced back compared to the prior 3-year average.
What happens next, particularly with AI-driven growth and heavy CapEx cycles, will be interesting to monitor for Big Tech going forward.
Intrinsic Value Growth vs. Market Perception
While intrinsic value growth follows the reinvestment-return math, shareholder return also depends on how the market values that growth.
Over short periods, valuation multiples (P/E, EV/EBITDA, etc.) can swing wildly based on sentiment, interest rates, or macro noise. Over long periods, however, earnings growth tend to dominate.
Consider this: if a company compounds earnings at 15% per year for 10 years, the stock will likely follow—even if the P/E ratio fluctuates along the way. That’s why obsessing over getting in at 18x vs. 24x earnings may be a big mistake and missed opportunity.
Measuring Returns: From ROIC to Cash-on-Cash
Beyond traditional metrics like ROIC, ROIIC, or ROCE, an investor can also evaluate Cash-on-cash returns: measuring the actual cash flow generated relative to capital invested.
I’ll be digging into this metric in more detail in an upcoming article, as I believe it does a great job of cutting through accounting noise and focusing on real capital productivity.
When adjusted for dilution or share buybacks, it becomes an even better tool— providing insight into the true shareholder return on investment and showing how reinvestment strategy and capital discipline combine to drive long-term value.
The Real-World Test: Are Expectations Realistic?
Here’s where it all comes together: investors should evaluate whether the growth “baked into” a company’s stock price is realistic.
Using tools like DCFs or reversed-engineered DCFs, you can back into what level of growth is needed to justify today’s price. Then, you ask: Is this company capable of reinvesting at the rate and return necessary to hit those numbers?
This creates an investor checklist:
✅ Is the company reinvesting a meaningful % of profits?
✅ Are those reinvestments generating high returns?
✅ Are these drivers sustainable over time?
✅ How is shareholder dilution or buyback activity affecting the results?
If you're interested in diving deeper into DCF and reverse-engineered DCF models, I’ve written a detailed article breaking down what they are and how to calculate them:📎 Understanding DCF and Reverse-Engineered DCF Models for Investment Decisions
For Paid Subscribers, my proprietary DCF and reverse DCF Excel models are available for download—featuring multiple examples from my Portfolio holdings and top Watchlist stocks. I update these models biweekly, and you can always find the latest versions in the 📎 Portfolio section of the blog (full details inside).
Final Thoughts: The Art and Math of Growth
Understanding growth isn’t about guessing what the stock will do next quarter but about dissecting the mechanics of compounding. Reinvestment rate × Return on Capital is a framework for long-term investing.
As Warren Buffett put it:
“The best business to own is one that over an extended period can employ large amounts of incremental capital at very high rates of return.”
Those are the businesses that build wealth. And as investors, our job is to find them before the rest of the market fully catches on.
🔐Subscribers: Proprietary Models for Calculating Intrinsic Value Growth
My Intrinsic Value Growth models (including Alphabet example) are available for download as Excel files at the very end of this post 👇
📌 Ongoing Updates: Throughout 2025, I’ll continue adding practical examples from Expanse Stocks portfolio holdings and Watchlist stocks. Paid subscribers can always access the latest versions in the Portfolio section.
If you want to get access to these models and more:
➕ Unlock Premium Content – For just $0.39/day ($12/month) or $0.27/day ($100/year)
📎 Full Portfolio Content - 🗓️ Biweekly Updates (Last Update: 28-June-2025)
📈 Biweekly Report – Portfolio updates, recent moves & watchlist additions
💼 Full Portfolio Access – Holdings, valuation metrics & performance tracking
📊 Valuation Tools – DCF, reverse DCF, capital efficiency & growth models
🎧 Podcast Picks – Biweekly handpicked episodes on business & investing
🔎 Stock Picking Framework – My methodology & investing philosophy
🎯 Swing Trading – Short-term strategy & latest swing trades
💬 Private Community Chat - 📎 Learn more
🔐 Full access to all my articles