

Understanding DCF and Reverse-Engineered DCF Models for Investment Decisions
Using as example two well-known firms: Alphabet (GOOGL) and ASML N.V. (ASML)

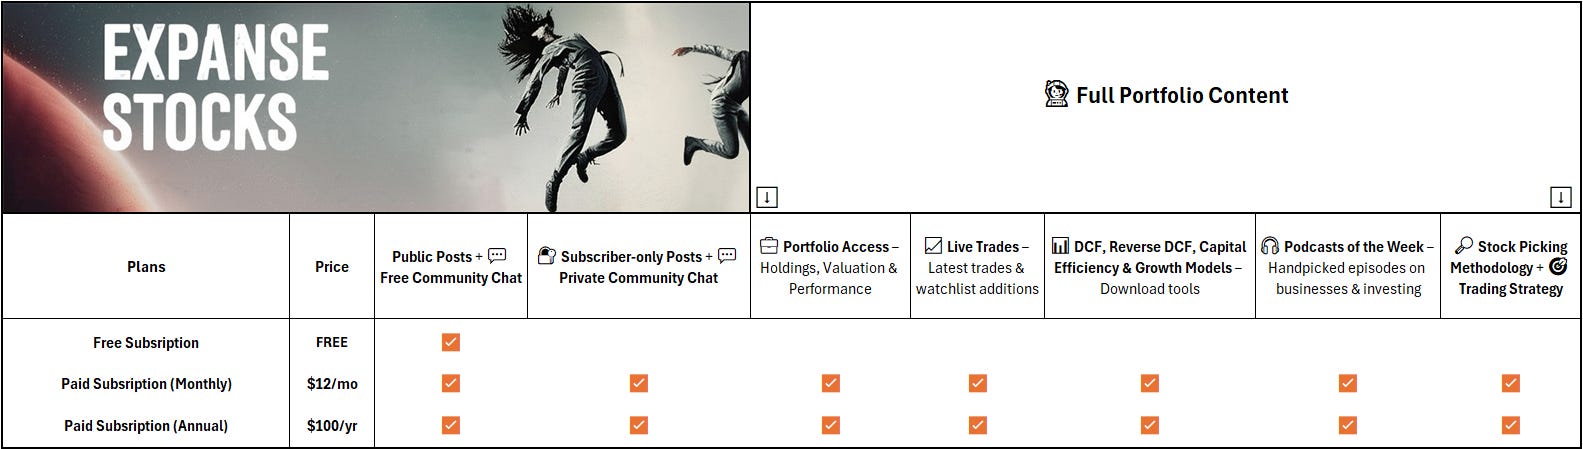
Unlock Premium Content – For just $0.39/day ($12/month) or $0.27/day ($100/year)!
📎 Full Portfolio Content - 🗓️ Monthly Updates (Last Update: 30-Nov-2025)
Expanse Stocks x Finchat.io Partnership!
🎁 Get 20% off + 2 months free on any Finchat plan! →📎 Claim Discount
Welcome back Explorer!

On this occasion, I’d like to address a fundamental yet often misunderstood topic: intrinsic value—what it really means—and how to apply Discounted Cash Flow (DCF) and Reverse-Engineered DCF models to assess a stock’s implied valuation and expected returns.
To make this practical and engaging, I’ll use two examples: Alphabet (GOOGL) and ASML as our “guinea pigs.”
Topics I’ll cover
Introduction to Valuation
Discounted Cash Flow (DCF)
Weighted Average Cost of Capital (WACC)
Beyond the Basics: Enhancing DCF
Reverse-Engineered DCF: A Fresh Perspective
Note on incorporating acquisitions into FCF calculations and valuation models
Downloadable proprietary Models (available for Paid subscribers)
We’ll break them down with a focus on what matters most for individual investors. Let’s dive in!
📰 What’s New at Expanse Stocks?
📊 Quarterly Update - Portfolio Composition (by Industry and Geography) + Valuation Metrics → 🔗 Behind-The-Scenes [Free access]
📚 Articles
🔎 Deep Dive Briefs
⛅ Cloudflare | 👷♂️ Parsons | 𓇲 MPS | 🥼 Medpace | 🔌 Arista | 🛒 Amazon | 🤖 ASML | 🦎 Topicus | 💡 Lumine | ✈ HEICO | 🧙♂️ CSU Part #1, Part #2, Part #3 | 🤖 Intuitive | 🛒 💳 MELI Part #1, Part #2
💸 General Investing
💎 Hidden Gems Series
✨ Annual Specials – Annual Letters, Investing Philosophy, Industry Write-ups & Top Picks of the Year
📚 Resources for Investors
📢 Latest Stock News
💬 Join My Chat → [📎 Learn more]
🔐 Paid Subscriber Exclusives
💼 Portfolio Corner – Holdings, valuation models, trades, performance & more!
🤫 Exclusive Sections – From select articles, Deep Dive Briefs & Hidden Gems
👀 Recent Releases!
👀 Coming Soon
🔎 Deep Dive Brief: Deconstructing Mercado Libre’s Optionality - Part III
✨ Expanse Stocks 2025 Annual Letter
➕ Unlock Premium Content – For just $0.39/day ($12/month) or $0.27/day ($100/year)!
🔗 Full Portfolio Content - 🗓️ Monthly Updates (Last Update: 30-Nov-2025)
📈 Biweekly Report – Portfolio updates, recent moves & watchlist additions
💼 Full Portfolio Access – Holdings, valuation metrics & performance tracking
📊 Valuation Tools – DCF, reverse DCF, capital efficiency & growth models
🎧 Podcast Picks – Biweekly handpicked episodes on business & investing
🔎 Stock Picking Framework – My methodology & investing philosophy
🎯 Swing Trading – Short-term strategy & latest swing trades
💬 Private Community Chat - 📎 Learn more
🔐 Full access to all my articles
Introduction to Valuation
Imagine walking into a marketplace where every item has a price tag. Some prices reflect the true worth of the item, while others are inflated by trends or hype. The stock market operates much the same way. While market prices fluctuate due to supply, demand, and sentiment, a stock’s intrinsic value—its true worth—is tied to its fundamentals: profits, cash flows, stock buybacks, and dividends.
Determining intrinsic value is important for investors. If the intrinsic value of a stock exceeds its market price, it could imply an opportunity to buy. But calculating this value is not easy. It involves putting together assumptions, forecasts, and a good deal of uncertainty. Valuation, at its heart, is as much art as it is science.
Discounted Cash Flow (DCF): The Core of Valuation
What is Discounting?
To understand DCF, picture this: someone offers you $1000 today or the same amount ten years from now. Common sense tells you to take the money now. Why? Because cash in hand today can be spent, invested, or even saved to grow over time. Future cash, on the other hand, loses value due to inflation, uncertainty, and the opportunity cost of waiting.
This concept—the time value of money—is why we discount future cash flows. Discounting adjusts these cash flows to reflect their value in today’s terms. It requires three key ingredients:
Future cash flow estimates
A discount rate, representing the expected return or cost of capital
The time period until the cash is received
Let’s break this down with an example. Suppose you expect to receive $1000 in 10 years, and the discount rate (r) is 10%. The formula for present value is:
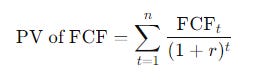
Where:
FCFt = Free Cash Flow in year t
r = Discount rate (typically the WACC —more on this later)
t = Time period (e.g., year 1, year 2, etc.)
n = Total number of periods
Plugging in the numbers, the present value of that FCF(t=10) = $1000 at r = 10% would be PV of FCF = $385.54:
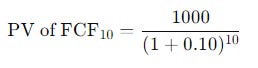
This means that $385.54 invested today at a 10% return would grow to $1000 in a decade. Two important insights emerge:
The further away the cash flow, the less it’s worth today.
The higher the discount rate, the steeper the discount applied.
Inputs for DCF Valuation
There are four essential ingredients for a DCF:
Current and historical cash flows
Expected growth in cash flows
Cost of capital (we will be using WACC)
Terminal value, representing the firm’s value beyond the forecast period
1. Calculating current and historical Free Cash Flow (FCF)
Here’s where it gets technical, but bear with me:
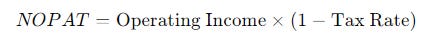
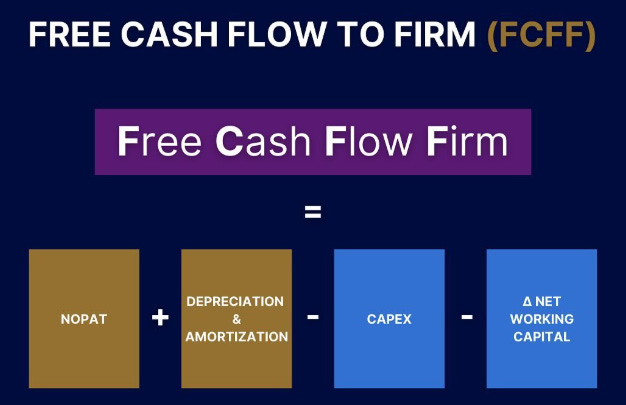
Start with after-tax operating income (also known as NOPAT) — more details here — which can be calculated using the company’s income statement.

Where:
Operating Income: Also known as EBIT, this is the profit a company makes from its core operations. Calculated as: Gross profits - Operating expenses
Tax Rate: The effective tax rate applied to the company's earnings. Calculated as: Income Tax Expense / Profit excluding tax expenses (EBT)
➕ Add back depreciation and amortization from the cash flow statement.
➖ Subtract capital expenditures (CapEx) & Acquisitions from the cash flow statement
➖ Substract changes in (non-cash) net working capital from the balance sheet.
Learn about this metric here 👉 What is Change in Net Working Capital?
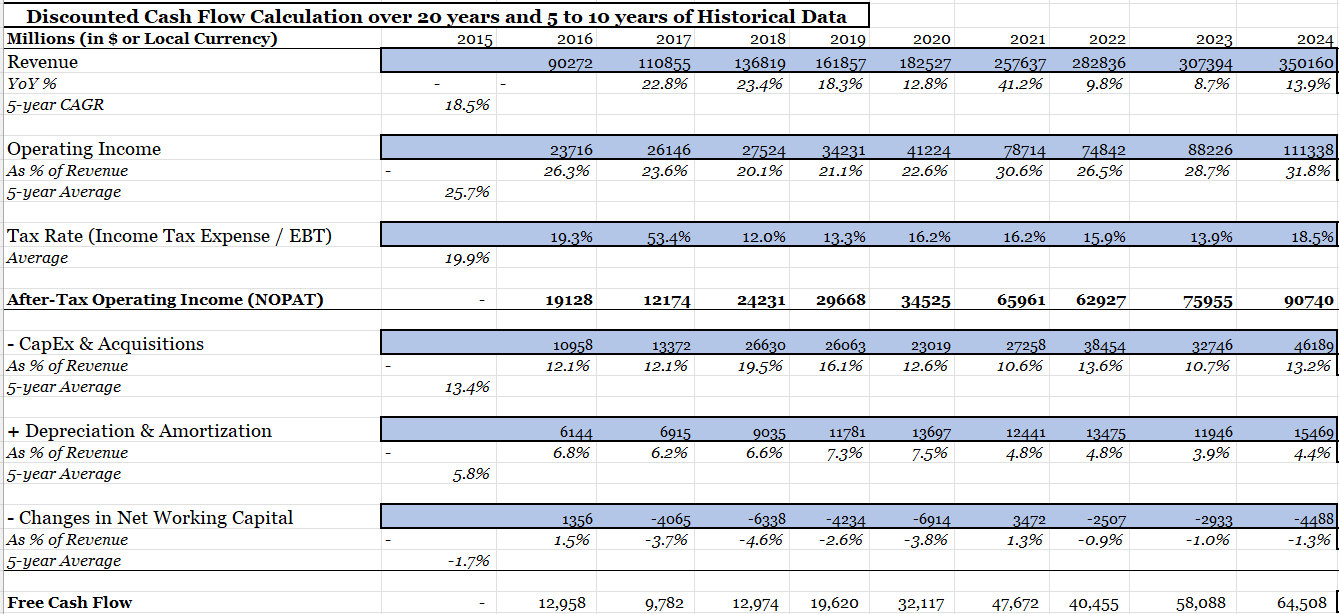
For example, if a company like Alphabet reports heavy spending on R&D and CapEx but shows consistent revenue growth, you’d factor these investments into its FCF. When calculating FCF, don’t just rely on averages—dig deeper. For instance, Alphabet’s net working capital trends are more stable than those of smaller tech firms, making it easier to project future cash flows.
Here’s my DCF Model calculations for Alphabet, detailing how I derived NOPAT and the resulting FCF using 5 to 10 years of historical and current financial data 👇
2. Forecasting Future Cash Flows
Forecasting is part science, part storytelling.
For Alphabet, its historical revenue growth average of nearly 20% is a strong foundation. But as markets saturate, it’s reasonable to expect growth to taper.
Assume high single-digit growth for the next five years (9% CAGR), gradually slowing as the company matures.
Next, project margins—Alphabet’s operating margin, for instance, might rise from its 5-year historical average of 28.7% to 34% over a long period of time, reflecting improved efficiencies. Last year’s Operating margins were around 30+%.
Here’s my DCF Model calculations for Alphabet, detailing how I derived the resulting FCF 20 years into the future based on the assumptions above 👇
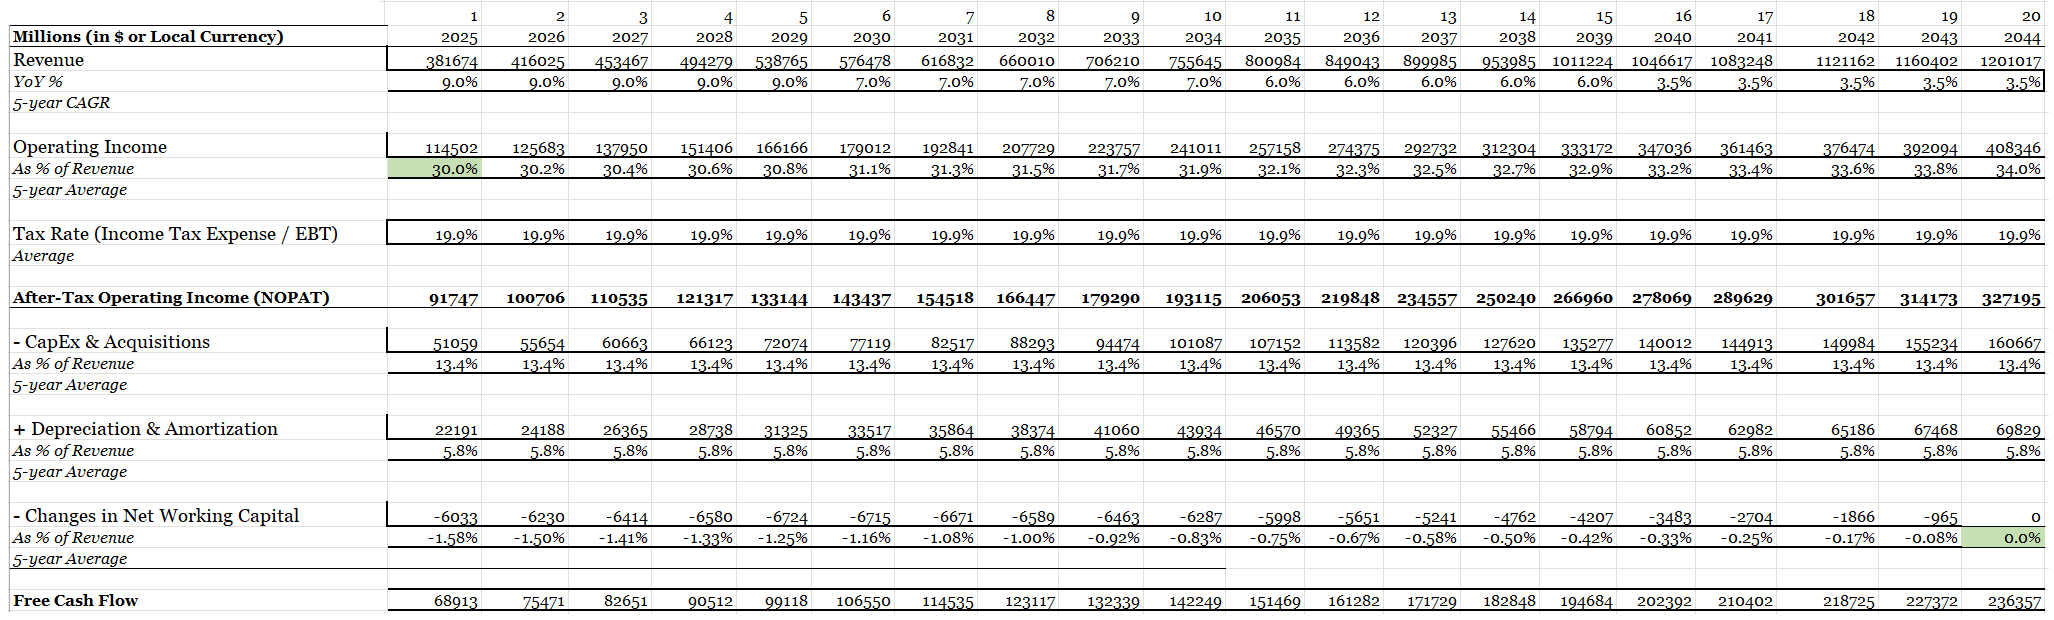
Here’s where creativity and caution meet. Overly optimistic assumptions can skew results, while overly conservative ones risk underestimating potential. Find a balance.
3. Discount Rate and WACC
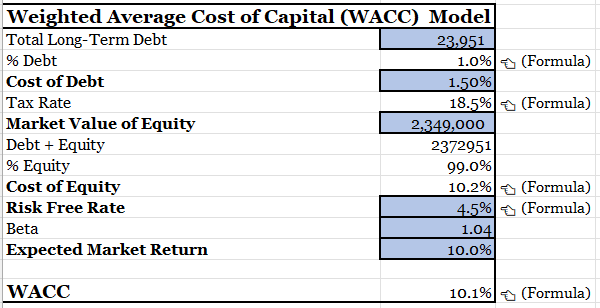
The discount rate anchors the entire valuation. Think of it as the investor’s yardstick—the higher the rate, the less forgiving the valuation. Companies typically calculate this using their Weighted Average Cost of Capital (WACC):
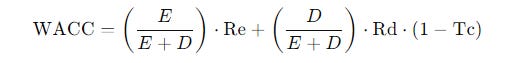
Where:
E: market value of the firm’s equity (= market capitalization)
D: Total Long-term Debt
Re: Cost of equity, calculated using CAPM: Re = Rf + β(Rm−Rf) —more details 📎 here
Rd: Cost of debt (calculated as Total Interest Expense / Total Long-term Debt)
Tc: Tax rate
For example, Alphabet’s WACC of 10.1% reflects the balance between its equity and debt financing. It’s like the company’s internal “cost of doing business” and becomes the rate used to discount future cash flows.
There are various tools available to calculate the WACC in a more straightforward manner. Some brokers offer WACC modeling, and there are also free-to-use tools like Finchat.io. For an example using Google, take a look at the following Finchat’s model 📎 here.
4. Terminal Value
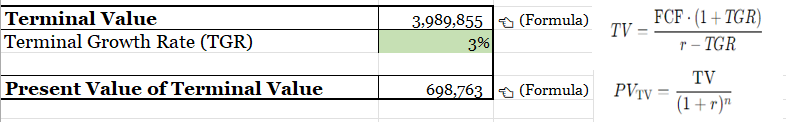
Now, let’s address the elephant in the room—what happens after the forecast period? Enter the Terminal Value (TV), which captures the company’s potential beyond the initial forecast in the DCF.
Think of it as the grand finale, where the most commonly used formula is the Perpetuity Growth Model:
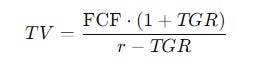
Where:
FCF: Free Cash Flow in the final forecasted year
TGR represents the terminal growth rate, often aligned with GDP growth (around 2-3% in mature economies like the U.S.)
r = Discount rate (typically the WACC)
The terminal value is then discounted back to the present, just like the earlier cash flows resulting in the Present Value of Terminal Value, as seen below:
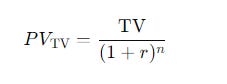
Where:
n: Estimated Number of years until Terminal Value is realized
Pulling It All Together
To summarize, a DCF model adds the present value of forecasted cash flows and the present value of the terminal value. Adjust for cash and debt, then divide by shares outstanding to determine the intrinsic share price.
For instance, if Alphabet’s calculated implied share price exceeds its market price, it’s likely undervalued. Simple in theory, challenging in practice.
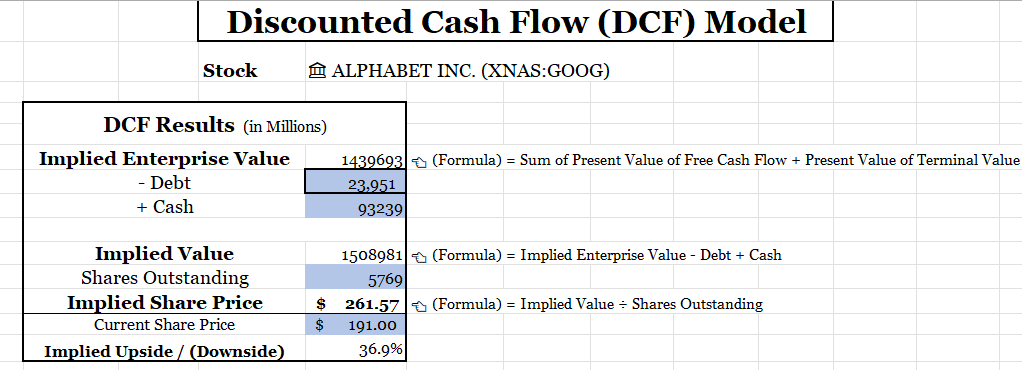
This implied upside was calculated based on a $191 share price as of the analysis date a few days ago, slightly below the stock’s current level. Add in the company’s ongoing share buyback program, with no dilution, and the potential returns look even more attractive.
Beyond the Basics: Enhancing DCF
No model is perfect, and a DCF is no exception. Forecasting inherently involves biases and estimation errors. To address these issues:
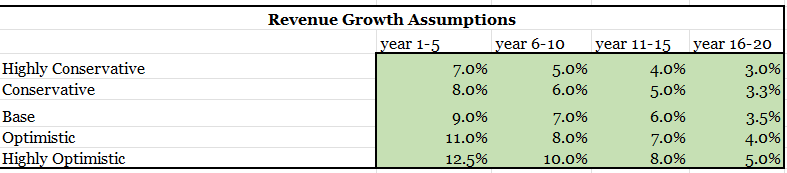
Use Sensitivity Analysis: Model scenarios with varying growth rates and operating margins.


Source: Alphabet’s Revenue Growth and Operating Margins assumptions for DCF model by Expanse Stocks. Extend the Forecast Period: High-quality companies often grow beyond the typical 10-year horizon used in DCF models. Take Alphabet, whose market dominance suggests a longer runway for growth. Personally, I use (at least) a 20-year horizon.
Reverse-Engineered DCF: A Fresh Perspective
Why Reverse-Engineer?
Traditional DCF models start with cash flow forecasts and calculate intrinsic value. But what if we flipped the script? A reverse-engineered DCF solves for the implied discount rate, revealing the expected annual return (CAGR) based on the stock’s current price.
It’s like working backward to answer, “What return can I realistically expect?”
How It Works
Begin with the stock’s current price or market cap.
Use forecasted cash flows and terminal value (same as for the DCF model).
Solve for the discount rate —this time use your expected CAGR, not the WACC— that aligns the present value of cash flows with the stock’s current price.
A Practical Example
Let’s use ASML as our guinea pig:
Let’s assume an Optimistic case where its revenue grows 15% annually for the next five years, then slows to 11%, 8%, and eventually 5%.
Operating margins improve from today’s 32% to 40% over two decades in our Base case scenario.
By plugging these assumptions into the Reverse DCF model, we calculate the implied share price—similar to the DCF model—and adjust the discount rate, this time our expected CAGR, until it aligns with ASML’s current market price.
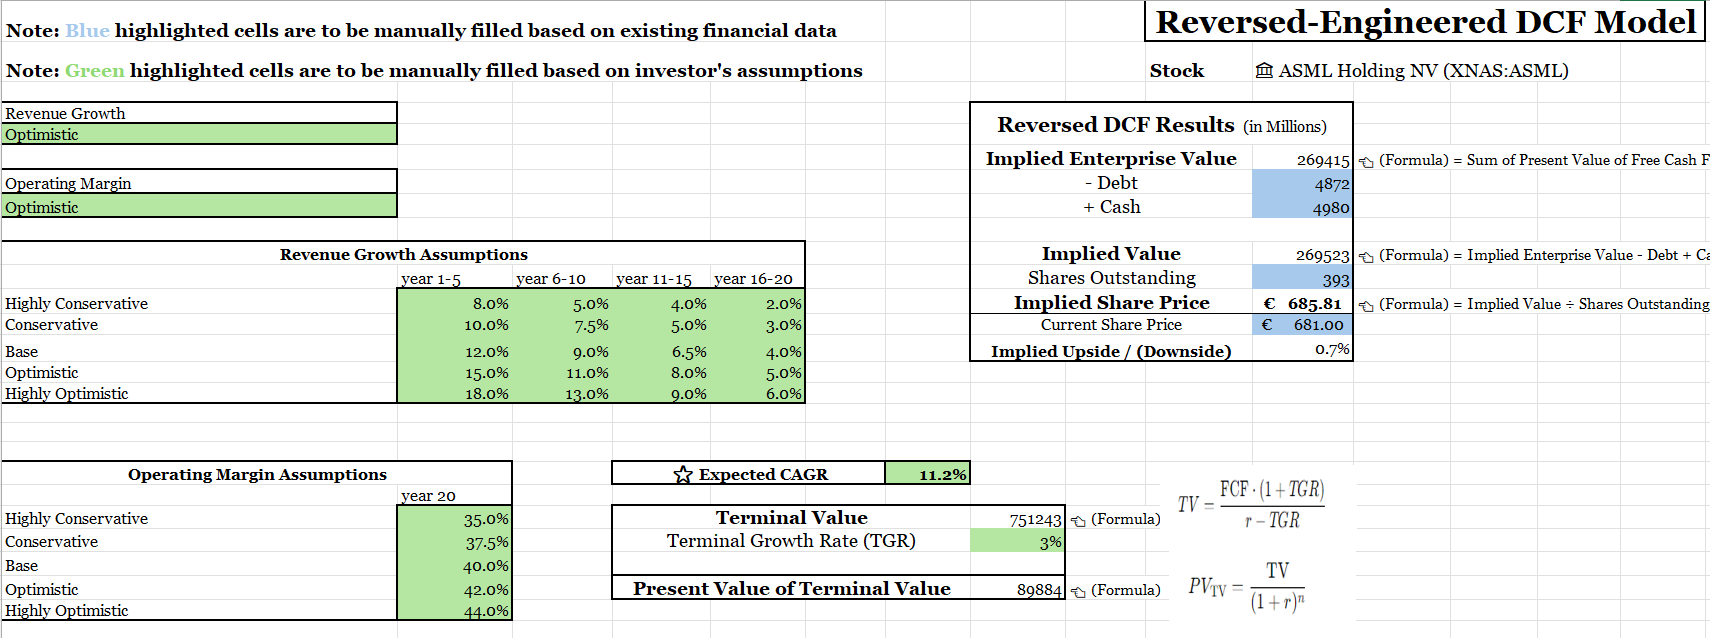
And voilà, the result is approximately 11.2%. This indicates that, under these assumptions, an investor could expect an 11.2% annual return.
When you factor in the company’s ongoing share buyback program and dividend payments, with no dilution, it becomes even more attractive. If your personal hurdle rate is 10%, this would suggest ASML is undervalued at its current price.
Why It’s Useful
A reverse-engineered DCF eliminates some of the guesswork in calculating WACC and focuses on the stock’s expected return. It also provides a clearer sense of whether a stock aligns with your investment goals.
⚠ Important Note
Challenges in Valuing Acquisitions: Incorporating acquisitions into FCF calculations and valuation models can be complex. Estimating costs, growth benefits, and synergies is challenging, whether for infrequent, large acquisitions or frequent, smaller ones.
Ignoring Acquisitions in DCF Models: You can assume acquisitions are "fairly priced," meaning the acquisition price equals the fair value of the target, with synergies fully captured by the seller. With this assumption, acquisitions become zero Net Present Value (NPV) investments, having no impact on the firm's overall value.
Caution Against Overestimating Growth: If you exclude acquisitions from your valuation, you must also exclude acquisition-driven growth. A common mistake is to extrapolate historical growth rates (which include acquisitions) while ignoring the cost of future acquisitions, leading to overvaluation.
Takeaway:
Consistency is Key: If acquisitions are excluded, exclude acquisition-driven growth in your projections.
Avoid Overvaluation: Do not count the growth benefits from acquisitions without factoring in their associated costs.
Final Thoughts
DCF and reverse-engineered DCF models are like two sides of the same coin—one focuses on intrinsic value, the other on expected returns.
Both require careful assumptions, critical thinking, and a touch of humility. As an investor, your goal isn’t to be perfectly accurate but to be less wrong than everyone else. After all, investing is as much about managing risks as it is about chasing rewards.
For Paid Subscribers, my DCF and reverse-engineered DCF models are available for download (including examples for ASML, Medpace and Alphabet) as Excel files linked below at the end of this post. 👇
And you can also find them in the Portfolio section of the blog.
➕ Unlock Premium Content – For just $0.39/day ($12/month) or $0.27/day ($100/year)!
📎 Full Portfolio Content - 🗓️ Monthly Updates (Last Update: 30-Nov-2025)
📈 Biweekly Report – Portfolio updates, recent moves & watchlist additions
💼 Full Portfolio Access – Holdings, valuation metrics & performance tracking
📊 Valuation Tools – DCF, reverse DCF, capital efficiency & growth models
🎧 Podcast Picks – Biweekly handpicked episodes on business & investing
🔎 Stock Picking Framework – My methodology & investing philosophy
🎯 Swing Trading – Short-term strategy & latest swing trades
💬 Private Community Chat - 📎 Learn more
🔐 Full access to all my articles
