

Understanding ROIC, ROIIC, and ROCE: Measuring Capital Efficiency
Using Alphabet (GOOG) as our "guinea pig"

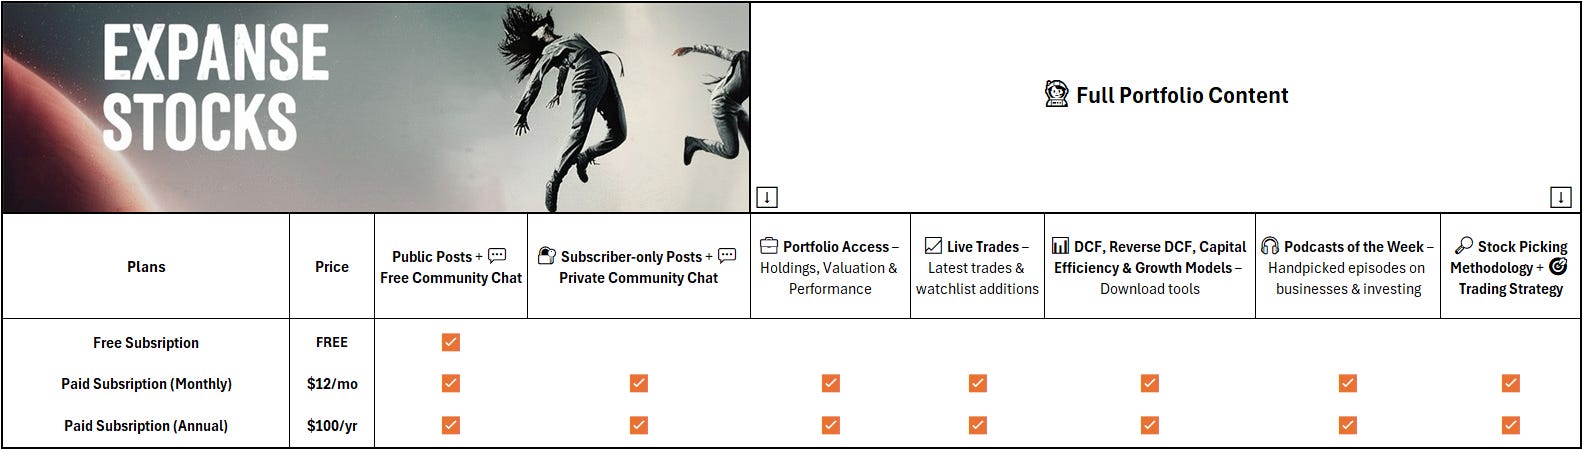
Unlock Premium Content – For just $0.39/day ($12/month) or $0.27/day ($100/year)!
🔗 Full Portfolio Content - 🗓️ Monthly Updates (Last Update: 26-Dec-2025)
Expanse Stocks x Finchat.io Partnership!
🎁 Get 20% off + 2 months free on any Finchat plan! → 🔗 Claim Discount
Welcome Explorer!

A few months ago, I wrote about an often misunderstood topic: Intrinsic Value, Discounted Cash Flow (DCF), and Reverse-Engineered DCF models to assess a stock’s implied valuation and expected returns. If you missed it and want to dive in, here’s the link: 📎 Understanding DCF and Reverse-Engineered DCF Models for Investment Decisions
Today, I want to tackle another fundamental topic: Capital Efficiency—how to measure and estimate how efficiently a company uses its capital through key metrics like:
✔️ Return on Invested Capital (ROIC)
✔️ Return on Capital Employed (ROCE)
✔️ Return on Incremental Invested Capital (ROIIC)
To keep this practical, I’ll use one well-known company: Alphabet (GOOG) as my "guinea pig".
Here’s what we’ll cover:

1️⃣ Introduction to Capital Efficiency
2️⃣ What is ROIC?
3️⃣ Going Beyond ROIC with ROIIC
4️⃣ ROIC vs. ROCE
5️⃣ Conclusion
6️⃣ Downloadable Proprietary Models (for Paid Subscribers)
Let’s break it down and focus on what truly matters for individual investors.
📰 What’s New at Expanse Stocks?
📊 Quarterly Update - Portfolio Composition (by Industry and Geography) + Valuation Metrics → 🔗 Behind-The-Scenes [Free access]
📚 Articles
🔎 Deep Dive Briefs
⛅ Cloudflare | 👷♂️ Parsons | 𓇲 MPS | 🥼 Medpace | 🔌 Arista | 🛒 Amazon | 🤖 ASML | 🦎 Topicus | 💡 Lumine | ✈ HEICO | 🧙♂️ CSU Part #1, Part #2, Part #3 | 🤖 Intuitive | 🛒 💳 MELI Part #1, Part #2, Part #3
💸 General Investing
💎 Hidden Gems Series
✨ Annual Specials – Annual Letters, Investing Philosophy, Industry Write-ups & Top Picks of the Year
📚 Resources for Investors
📢 Latest Stock News
💬 Join My Chat → [🔗 Learn more]
🔐 Paid Subscriber Exclusives
💼 Portfolio Corner – Holdings, valuation models, trades, performance & more!
🤫 Exclusive Sections – From select articles, Deep Dive Briefs & Hidden Gems
👀 Recent Releases!
👀 Coming Soon
🔍 Deep Dive Brief: Cadence
Introduction
Investing is all about putting capital to work in a way that generates sustainable, high returns. But how do we measure how efficiently a company uses its capital?
Enter Return on Invested Capital (ROIC), Return on Incremental Invested Capital (ROIIC), and Return on Capital Employed (ROCE)—three financial metrics that help us, investors, gauge a company’s profitability and capital efficiency.
These metrics serve as a guide to distinguish between businesses that create long-term value and those that grow revenue without improving shareholder returns. In this article, we’ll break down what each of these metrics represents, how they are calculated, and why they matter for investment decisions.
What is ROIC?
Return on Invested Capital (ROIC) is one of the most used indicators of a company's financial health. It measures how efficiently a business generates profit relative to the capital invested in its operations.
📌 Formula:

NOPAT represents the company’s operating profit after taxes, excluding financing costs.
Invested Capital includes working capital, property, plant, equipment (PP&E), goodwill, and intangible assets. 🧐 We will dive deeper into it on next sections.
ROIC as a Benchmark
A business creates value when its ROIC exceeds its cost of capital — often estimated using the Weighted Average Cost of Capital (WACC). I like to call it the “cost of doing business”.
If a company has a ROIC of 12% and a cost of capital of 8%, it is generating a 4% return above what it costs to finance its operations. This positive spread translates into real economic value for shareholders.
🧐 Note: If you want to know more about NOPAT and how to calculate WACC, feel free to read my piece 📎 Understanding DCF and Reverse-Engineered DCF Models for Investment Decisions
Why ROIC Matters
Many investors mistakenly equate earnings growth with value creation. However, growth without a high ROIC can destroy shareholder value. Consider these two businesses:
1️⃣ Company Alpha: A High-ROIC Business Generating Value
Current Invested Capital: $150M
Operating Profit (NOPAT): $27M
Return on Invested Capital (ROIC): 18%
Cost of Capital: 8%
Now, suppose Company Alpha expands by investing an additional $30M, increasing total invested capital to $180M.
At 18% ROIC, the new profit becomes $32.4M ($180M × 18%).
The expansion cost, based on the 8% cost of capital, is $2.4M ($30M × 8%).
The net value creation: $3M → $5.4M profit increase - $2.4M capital cost.
Since ROIC (18%) exceeds the cost of capital (8%), Company Alpha generates excess returns, compounding shareholder value over time.
2️⃣ Company Beta: A Low-ROIC Business Destroying Value
Current Invested Capital: $150M
Operating Profit (NOPAT): $9M
Return on Invested Capital (ROIC): 6%
Cost of Capital: 8%
Now, suppose Company Beta expands by investing an additional $30M, increasing total invested capital to $180M.
At 6% ROIC, the new profit becomes $10.8M ($180M × 6%).
The additional investment generates only $1.8M in new profit ($30M × 6%).
However, at an 8% cost of capital, the expansion costs $2.4M ($30M × 8%).
Net Value Destruction: -$0.6M → ($1.8M profit increase - $2.4M capital cost).
Since ROIC (6%) is lower than the cost of capital (8%), Company Beta is destroying shareholder value with every dollar invested. Over time, if this pattern continues, it can lead to stagnation, declining stock performance, or even financial distress.
ROIC and the "One Dollar Test"
Morgan Stanley's deep research on ROIC —📎 How to Calculate ROIC and Handle Common Issues.pdf — highlights the One Dollar Test, a simple and effective way to determine whether a company is creating real value. If a company invests $1 in capital expenditures and generates returns that exceed its cost of capital, it is adding value. However, if its returns are lower than the cost of capital, it is effectively destroying value. This is what we saw in the previous example with Company Alpha and Beta.
Consider three scenarios:
Value-Destroying Business: A company invests $10,000 with a costa of capital of 8% but generates only $500 per year in perpetuity. Its discounted value is $6,250 ($500/0.08), meaning the investment is worth less than the capital used—failing the one-dollar test.
Neutral Business: A firm generates exactly $800 per year, equating to the original $10,000 investment ($800/0.08), meaning it neither creates nor destroys value.
Value-Creating Business: If the same company generates $1,100 annually, the investment is now worth $13,750 ($1,100/0.08), passing the test and delivering true shareholder value.
This explains why achieving earnings growth isn’t enough—growth without high ROIC does not create value.
Step-by-Step Guide to Calculating ROIC
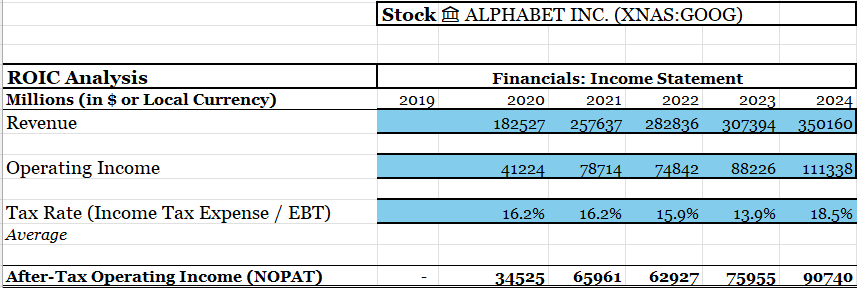
Let’s take Alphabet (GOOG) as our guinea pig for this exercise:
1️⃣ Determine NOPAT – From the Income Statement
✅ Start with Operating Income (EBIT)
✅ Subtract Taxes (apply the effective tax rate to EBIT)
2️⃣ Calculate Invested Capital – From the Balance Sheet
Invested capital represents the assets a company needs to generate NOPAT. These include plants, equipment, real estate, software, and other critical resources.
Invested Capital = Working Capital + Non-Current Operating Assets
✅ Working Capital → (Current Assets - Non-Interest-Bearing Liabilities), excluding excess cash & marketable securities.
✅ Non-Current Operating Assets → Property, Plant & Equipment (PPE), Intangibles, and other long-term assets. If acquisitions were done, you may or may not include Goodwill (I’ll explain this later).
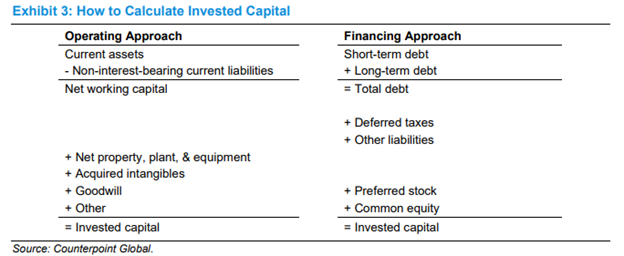
Note: For the Financing Approach, use the Cash Flow Statement instead. Personally, I go with the Operating Approach.
Two Approaches to Calculating Invested Capital:
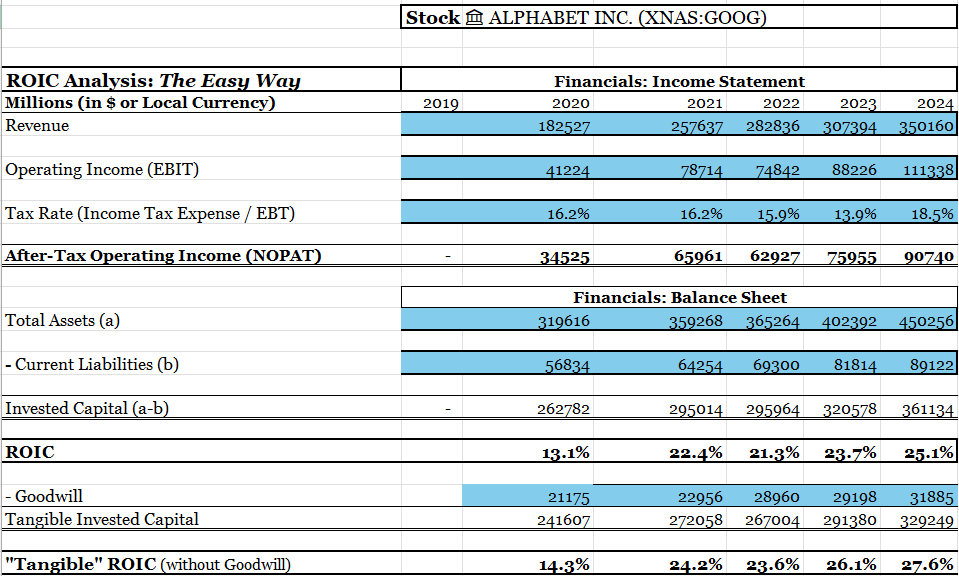
🔹 Easy Way ("All-In" Invested Capital) – Quick but Less Precise
📌 Formula: Invested Capital = Total Assets - Current Liabilities
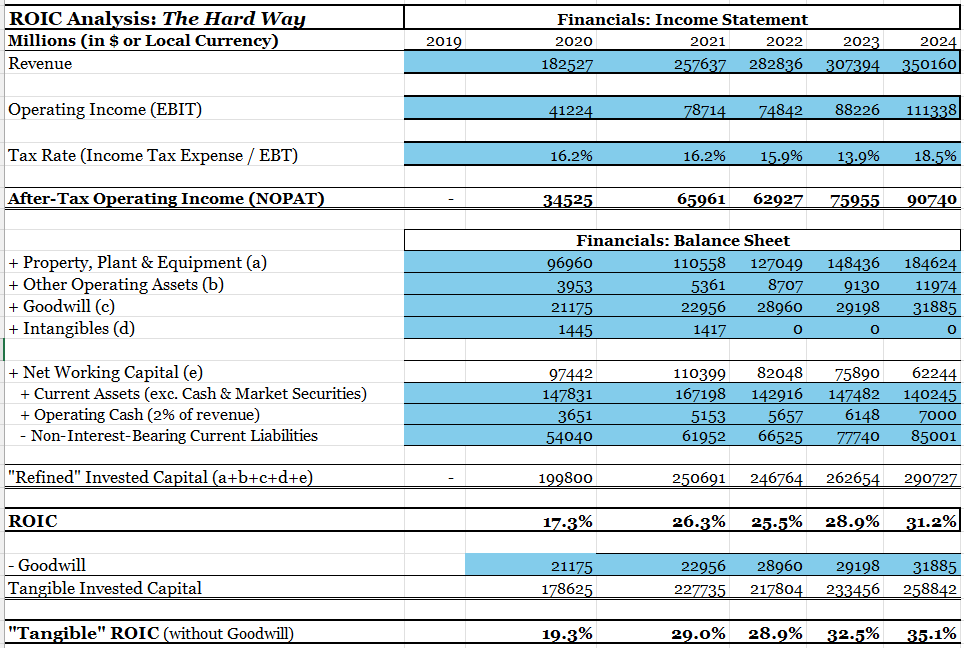
🔹 Hard Way ("Refined" Invested Capital) – More Complex but More Accurate
📌 Formula: Invested Capital = PPE + (Goodwill + Intangibles + Other Operating Assets) + Net Working Capital
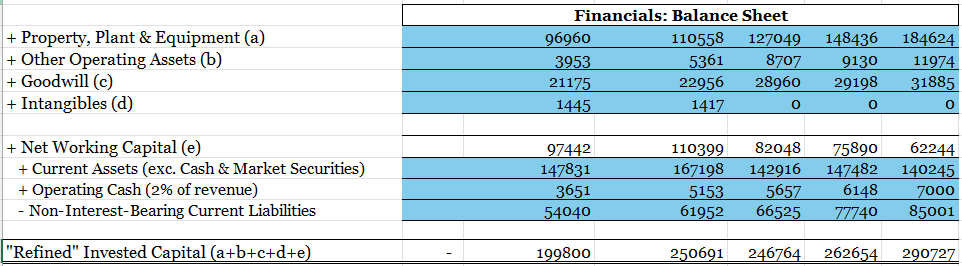
📌 Net Working Capital = Current Assets - Non-Interest-Bearing Liabilities, including operating cash but excluding excess cash & marketable securities.
At first glance, net working capital might seem complex, but it’s actually quite straightforward:
✅ Non-Interest-Bearing Current Liabilities → Includes all current liabilities except debt
✅ Current Assets (incl. operating cash & excl. excess cash & marketable securities) → Standard current assets, minus excess cash & marketable securities —cash and short term investments that aren’t needed for day-to-day operations, plus operating cash — since only a portion of cash is needed for daily operations, it’s common to use an estimated amount of 2% to 5% of the total generated revenue for the year.
Should You Include Goodwill in Invested Capital?
🔹 What is Goodwill?
Goodwill appears on a company’s balance sheet only after an acquisition and represents the excess amount paid over net asset value and identifiable intangibles. It attempts to capture brand value, synergies, customer relationships, or other competitive advantages.
✅ ROIC with Goodwill → Measures a company’s ability to create value after paying for acquisitions (useful for evaluating management’s capital allocation).
✅ “Tangible” ROIC without Goodwill → Measures the underlying competitiveness of the core business —better for intrinsic valuation and business quality assessment.
🔹 Best Practice
For a complete picture, calculate both ROIC with and without goodwill. This helps separate operational efficiency from management’s acquisition decisions and ensures a clearer valuation analysis.
3️⃣ Calculate ROIC: Divide NOPAT by Invested Capital
Easy Way ROIC ("All-In" Invested Capital) – Quick but Less Precise
Hard Way ROIC ("Refined" Invested Capital) – More Complex but More Accurate
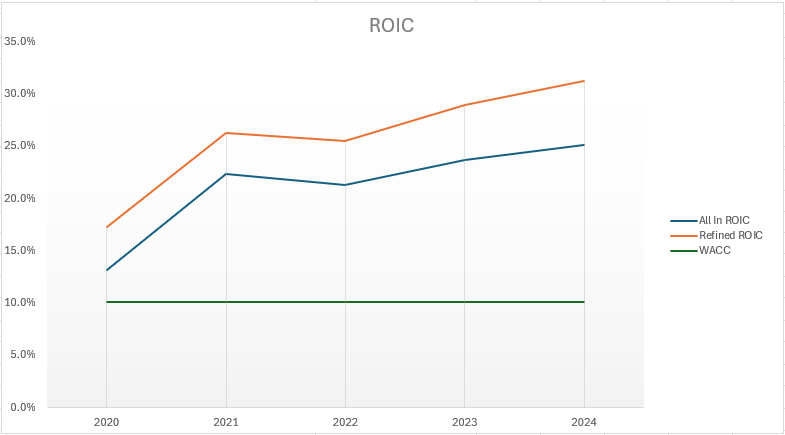
By consistently achieving a high ROIC > WACC (around 10.1% for GOOG last few years), companies like Google or Apple have compounded shareholder value for decades.
However, high ROIC alone isn't enough—we also need to examine the trend and sustainability of these returns with the help of another metric called ROIIC.
Going Beyond ROIC with ROIIC
What is ROIIC?
Return on Incremental Invested Capital (ROIIC) measures the return on newly invested capital, answering the question: “How effective is the company at deploying additional capital?”
📌 Formula:

🔁 In words:
You compare incremental NOPAT over one year to the incremental capital invested in the year before that.
This properly matches returns generated in a year to the capital invested in the prior year, since returns take time to manifest.
ROIIC is a forward-looking metric that helps identify companies that are not just efficient but also improving. If a company’s ROIIC is consistently higher than its existing ROIC, it suggests that new investments are yielding even better returns.
Practical Example: Google’s ROIIC
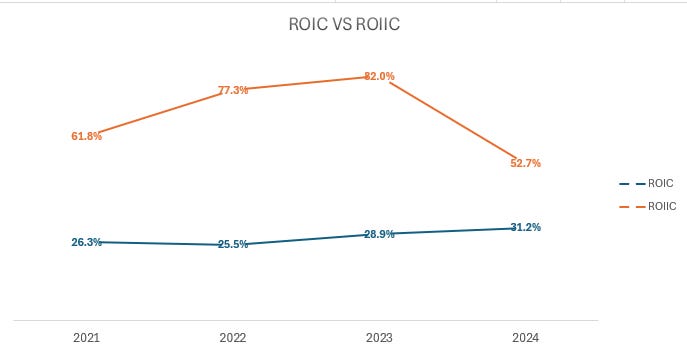
In 2024, Google’s NOPAT was $90.74B, up from $76B in 2023. Over the prior years 2023 and 2022, its invested capital increased from $262.6B to $290.7B.
Resulting in an incremental ROIC of 52.7%, higher than its 31.2% ROIC ending 2024 fiscal year.
The historical ROIIC vs ROIC trend suggests Google’s new investments are significantly more profitable than its historical ROIC as seen below.
⚠️ Note: Recent heavy AI-related CapEx investments are weighing on these metrics for hyperscalers, including Google. It’ll be interesting to see where things stand by the end of 2025.
ROIC vs. ROCE
What is ROCE?
Return on Capital Employed (ROCE) measures how efficiently a company generates profits from all available capital employed, including both equity and debt. It’s useful for evaluating capital allocation across different capital structures.
📌 Formula:
Where:
✅ EBIT (Earnings Before Interest and Taxes) measures pre-tax operating profit.
✅ Capital Employed = Total Assets - Current Liabilities or Equity + Non-current Liabilities (both from the Balance Sheet).
Unlike ROIC, which focuses on operational investments, ROCE accounts for all capital sources, including both equity and debt financing, providing a broader efficiency metric.
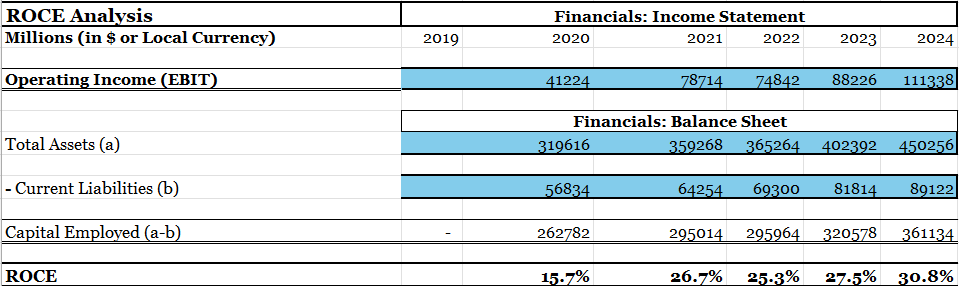
Here is the Google’s ROCE example:
👀 Capital Employed vs. Invested Capital
🔹 Capital Employed = Total Capital Sources (Equity + Long-term Debt) - Short-term Liabilities → A broader financial metric than Invested Capital.
🔹 Invested Capital = Capital actively used in operations → A more precise measure of operational efficiency.
While both assess efficiency, capital employed provides a more holistic financial picture, while invested capital focuses on operational returns.
Why ROCE Matters?
✔ Broad Efficiency Measure – Useful for analyzing companies with varying debt levels.
✔ Acquisition Analysis – Helps assess if an acquisitive company is generating sufficient returns.
✔ Industry Comparisons – A benchmark to compare companies with different capital structures.
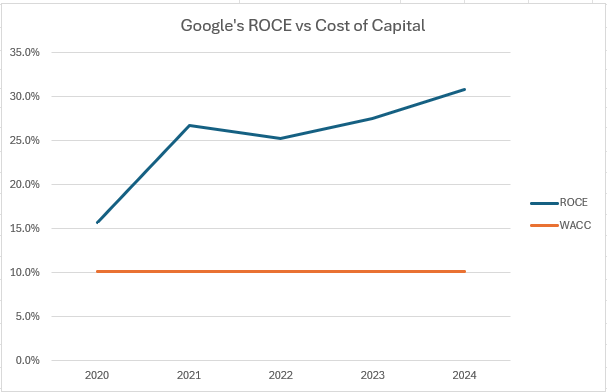
📌 Rule of Thumb:
A good ROCE should be at least twice the prevailing interest rates.
💡 Example: If a company has a ROCE of 12% while borrowing at 5% (2x5% < 12%), it demonstrates strong capital efficiency.Look for ROCE above 10% as a benchmark. Anything above 15% consistently is spectacular. Also, smaller companies and companies from emerging markets should also exceed 15%.
Googles’ example:
ROCE in Different Business Models
While often used for capital-intensive industries (utilities, manufacturing), ROCE is also valuable for other industries and different type of businesses, including more complex businesses to value like serial acquirers:
✔ Constellation Software (CSU): Acquires niche vertical software companies—a high ROCE may indicate acquisitions generate sufficient returns on investment.
✔ Berkshire Hathaway (BRK): Warren Buffett’s conglomerate uses ROCE to assess if acquired businesses make good use of capital.
✔ Danaher Corporation (DHR): Expands through acquisitions—high ROCE ensures value creation across its diversified industrial and life sciences businesses.
Key Takeaway
While ROIC is better for evaluating a company’s core operational efficiency, ROCE is useful for analyzing businesses with acquisitions or significant debt financing.
Conclusion
Mastering ROIC, ROIIC, and ROCE gives investors an edge in identifying high-quality businesses:
✔ ROIC → Measures operational efficiency & long-term value creation.
✔ ROIIC (forward-looking metric) → Tracks returns on newly invested capital and identifies business improvement when it exceeds historical ROIC
✔ ROCE → Evaluates broader financial efficiency and helps to compare companies across industries (from capital-intensive to acquisitive companies).
By integrating these metrics into investment analysis, investors can make smarter decisions about capital allocation, efficiency, and profitability.
📌 Key Takeaway: Seek businesses with consistently high ROIC, improving ROIIC, and a strong ROCE trend—but don’t rely on numbers alone. Competitive advantages, reinvestment strategies, and market positioning matter just as much.
In a future release, I will be tackling the topic of reinvestment rates and how if affects shareholders returns.
The next section is reserved for paid subscribers.
🔐Subscribers: Proprietary Models for ROIC, ROIIC & ROCE
My ROIC, ROIIC, and ROCE models (including GOOG but also AMZN and ASML example) are available for download as Excel files at the end of this post.
📌 Ongoing Updates: Throughout 2025, I’ll continue adding practical examples from Expanse Stocks portfolio holdings and Watchlist stocks. Paid subscribers can always access the latest versions in the Portfolio.
➕ Unlock Premium Content – For just $0.39/day ($12/month) or $0.27/day ($100/year)!
📎 Full Portfolio Content - 🗓️ Monthly Updates (Last Update: 30-Nov-2025)
📈 Biweekly Report – Portfolio updates, recent moves & watchlist additions
💼 Full Portfolio Access – Holdings, valuation metrics & performance tracking
📊 Valuation Tools – DCF, reverse DCF, capital efficiency & growth models
🎧 Podcast Picks – Biweekly handpicked episodes on business & investing
🔎 Stock Picking Framework – My methodology & investing philosophy
🎯 Swing Trading – Short-term strategy & latest swing trades
💬 Private Community Chat - 📎 Learn more
🔐 Full access to all my articles
